English only
 |
 |
| (a) | (b) |
 |
 |
| (c) | (d) |
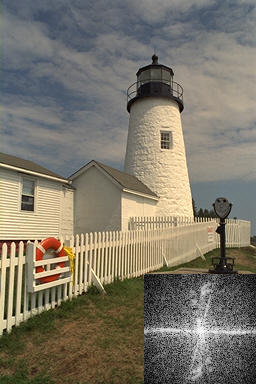
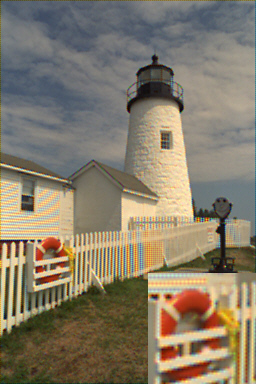
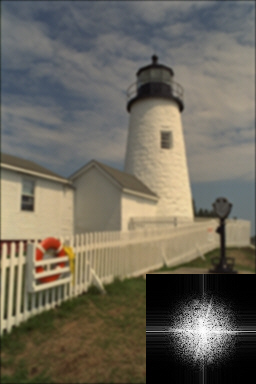
| Figure 2: Example of a bilinear interpolation computed with convolution filters. (a) Original image: the frequency spectrum of the red (and green and blue) occupies most of the Fourier spectrum. (b) Reconstructed image with bilinear interpolation. (c) Low pass filtering applied to the original image to reduce the size of the Fourier spectrum of the image. (d) The reconstruction of image (c) after mosaicing according to the Bayer CFA and demosaicing by bilinear interpolation shows no artifacts. | |