English only
 |
|
| (a) | |
 |
 |
| (b) | (c) |
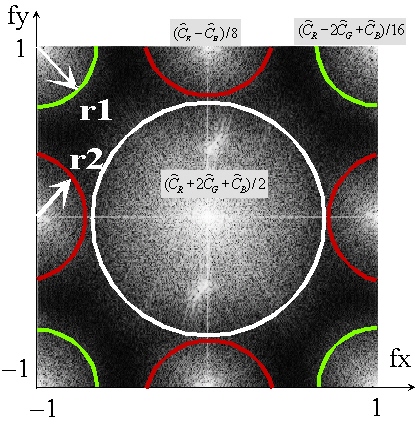
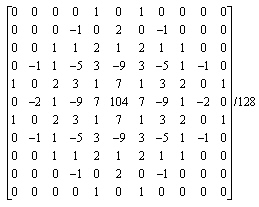
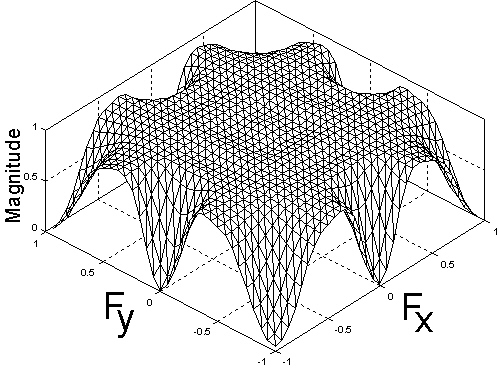
| Figure 4: (a) Fourier representation of a CFA image. The energy of the luminance is concentrated in the center of the image. The energy of chrominance is located on the borders. (b) The luminance filter used in the simulations discussed in Section V. (c) Representation of the transfer function of the luminance estimation filter. | |